Functions
1.Pipeline Schematic
2.Screen
3.Classify
4.ERVRegions
Pipeline Schematic
large version
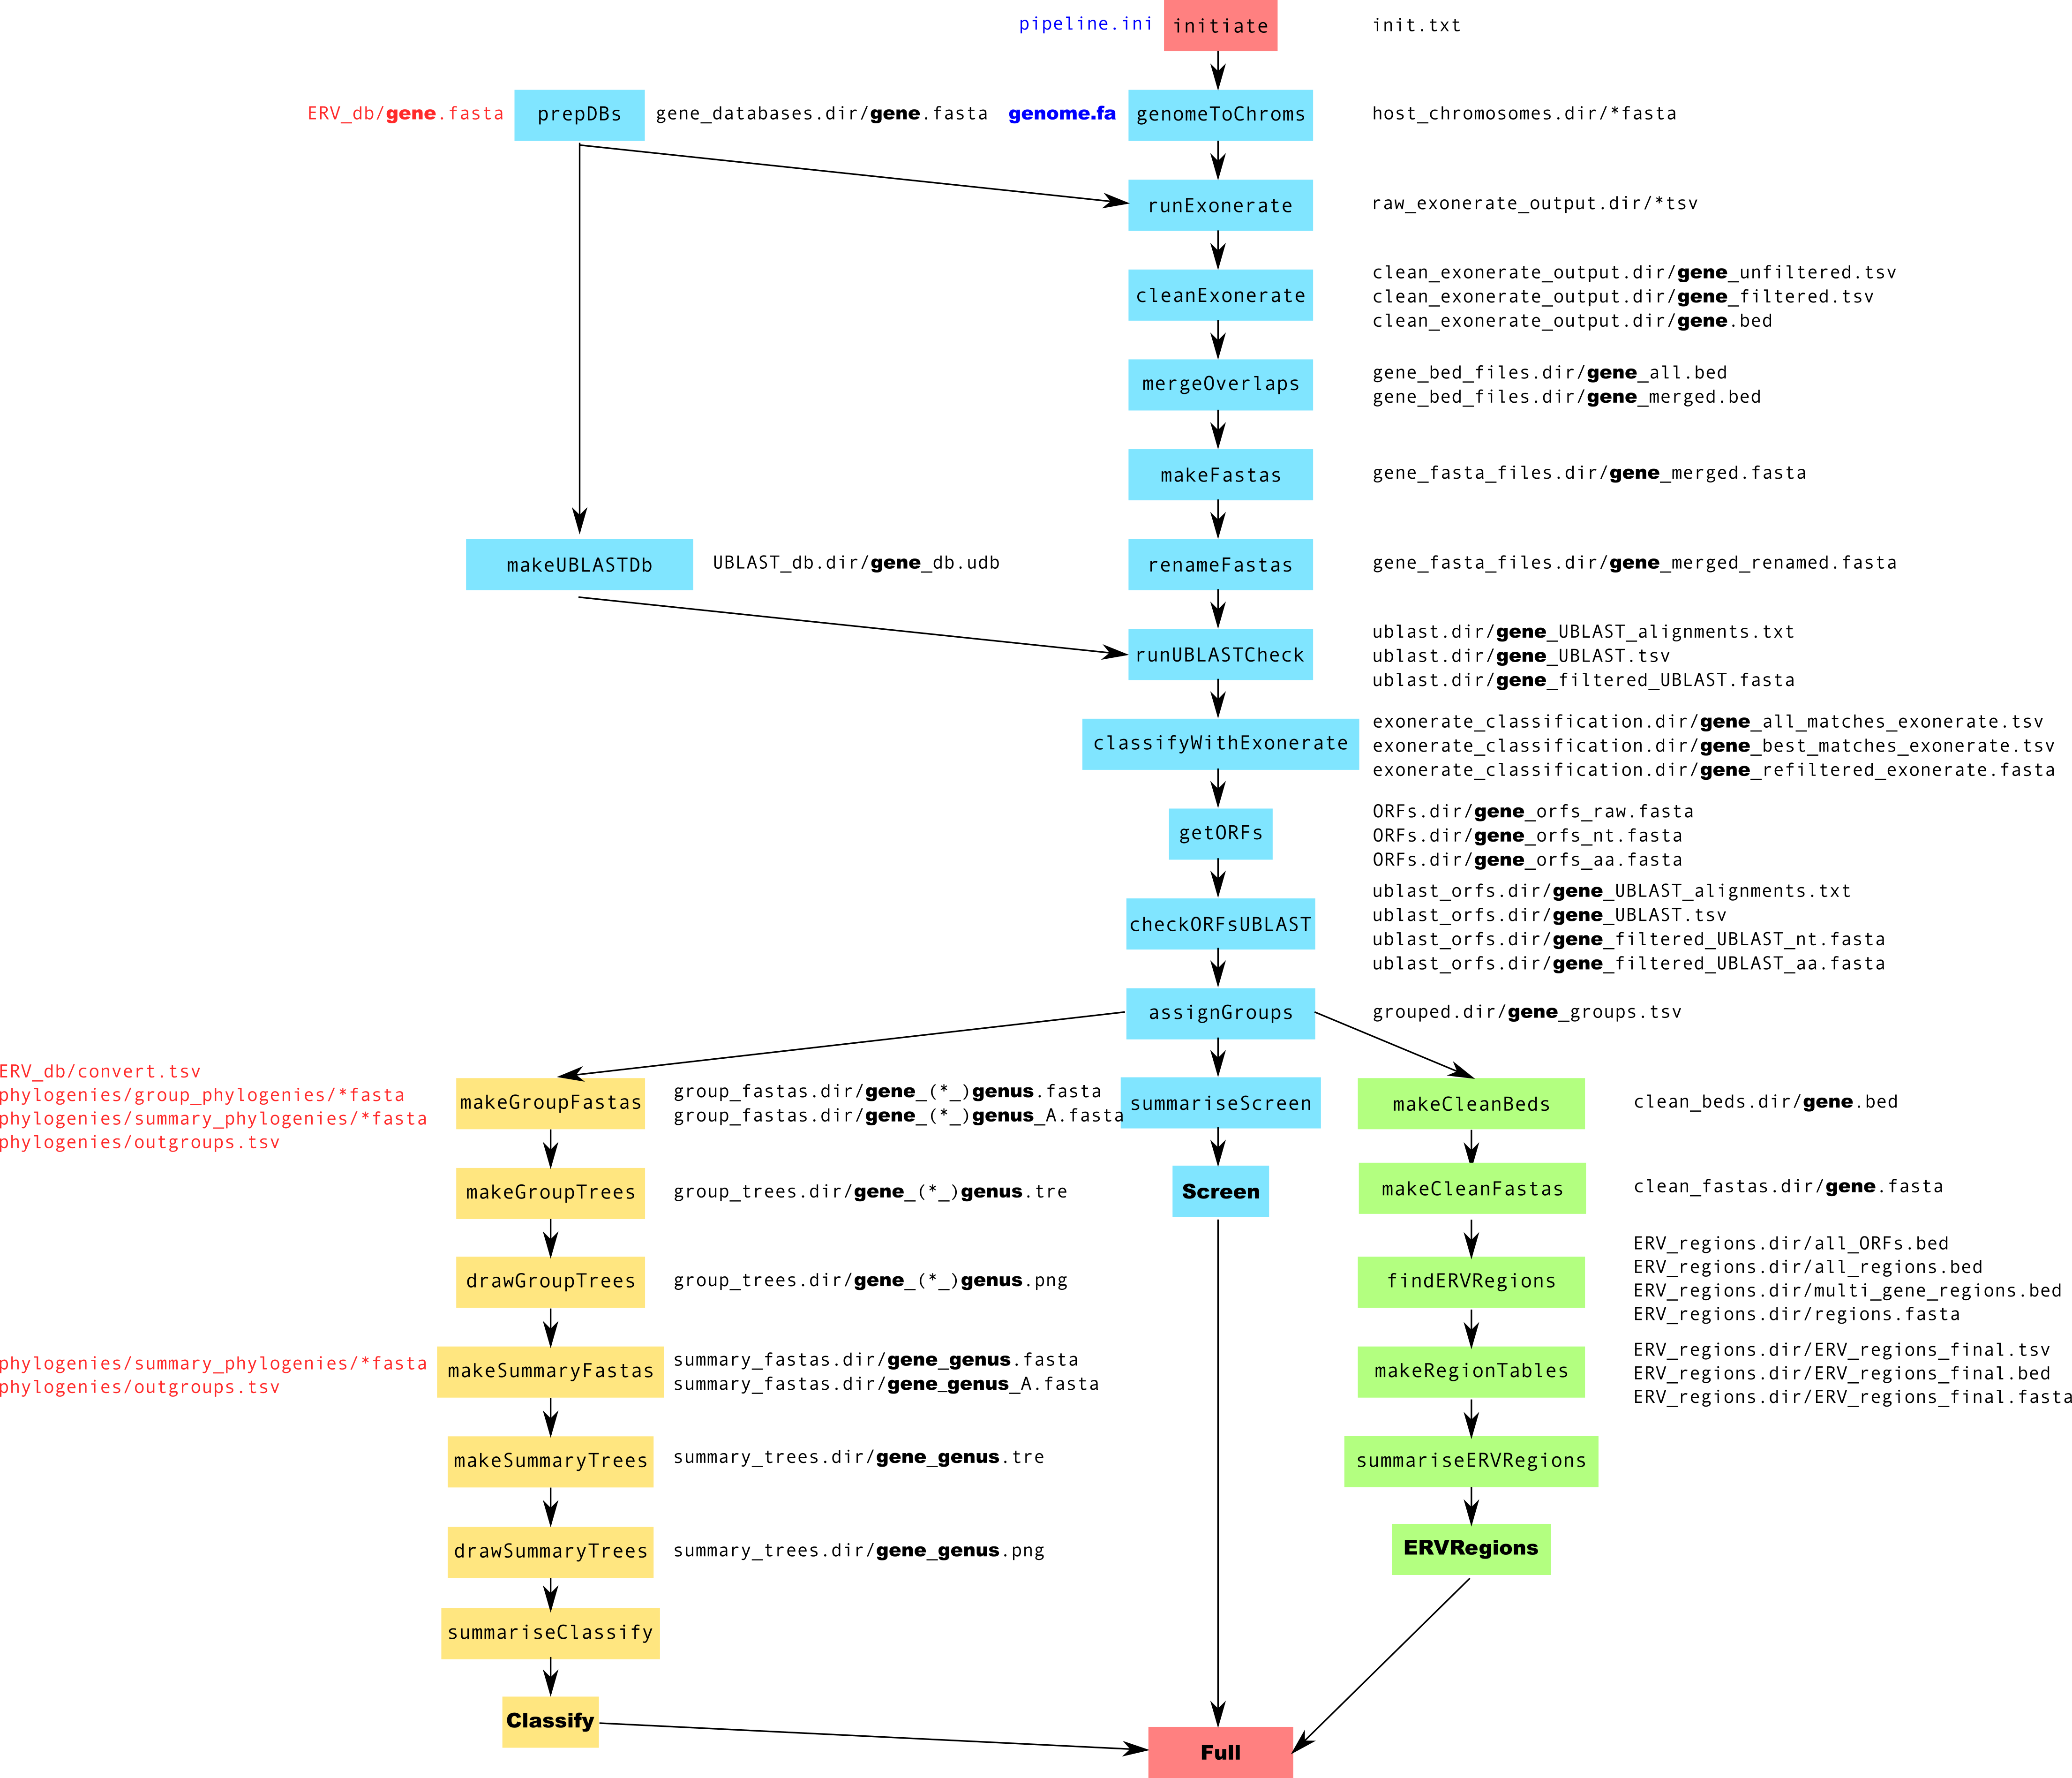 ../images/pipeline.png
NB: Where
../images/pipeline.png
NB: Where GENE is specified in a file path one file will be created for each gene - gag, pol and env (unless otherwise specified by the user).
Screen
Screens the genome for ERV like regions by comparing the genome to a set of known retroviral ORFs using Exonerate.
Confirms the Exonerate regions using UBLAST
Finds and confirms ORFs within these regions
Finds the most similar known retroviral ORF in the database to each of the newly identified ORFs
initiate
Input Files
pipeline.ini
Output Files
init.txt
Parameters
[genome] file
[paths] path_to_usearch
[paths] path_to_exonerate
Initialises the pipeline and checks that the required parameters in the pipeline.ini are set and valid and that the required software is in your $PATH.
Checks that:
The input genome file exists.
The correct path to ERVsearch is provided.
samtools, bedtools, FastTree and mafft are in the $PATH
The correct paths to usearch and exonerate are provided.
init.txt is a placeholder to show that this step has been completed.
genomeToChroms
Input Files
[genome] file
keep_chroms.txt
Output Files
host_chromosomes.dir/*fasta
Parameters
[genome] file
[genomesplits] split
[genomesplits] split_n
[genomesplits] force
Splits the host genome provided by the user into FASTA files of a suitable size to run Exonerate efficiently.
If genomesplits_split in the pipeline.ini is False, the genome is split into one fasta file for each sequence - each chromosome, scaffold or contig.
If genomesplits_split in the pipeline.ini is True, the genome is split into the number of batches specified by the genomesplits_splitn parameter, unless the total number of sequences in the input file is less than this number.
The pipeline will fail if the number of sequences which would result from the genomesplits settings would result in >500 Exonerate runs, however it is possible to force the pipeline to run despite this by setting genomesplits_force to True.
If the file keep_chroms.txt exists in the working directory only chromosomes listed in this file will be kept.
An unzipped copy of zipped and gzipped fasta files will be created or a link to the file if it is already unzipped. this will be named genome.fa and be in the working directory.
This function generates a series of fasta files which are stored in the host_chromosomes.dir directory.
prepDBs
Input Files
None
Output Files
gene_databases.dir/GENE.fasta
Parameters
[database] use_custom_db
[database] gag
[database] pol
[database] env
Retrieves the gag, pol and env amino acid sequence database fasta files and puts a copy of each gene_databases.dir directory.
If custom databases are used they are retrieved and named as gag.fasta pol.fasta, env.fasta so the path doesn’t need to be changed every time.
runExonerate
Input Files
gene_databases.dir/GENE.fasta
host_chromosomes.dir/*fasta
Output Files
raw_exonerate_output.dir/GENE_*.tsv
Parameters
[paths] path_to_exonerate
Runs the protein2dna algorithm in the Exonerate software package with the host chromosomes (or other regions) in host_chromosomes.dir as target sequences and the FASTA files from prepDBs as the query sequences.
The raw output of Exonerate is stored in the raw_exonerate_output directory, one file is created for each combination of query and target sequences.
This step is carried out with low stringency as results are later filtered using UBLAST and Exonerate.
cleanExonerate
Input Files
raw_exonerate_output.dir/GENE_*.tsv
Output_Files
clean_exonerate_output.dir/GENE_*_unfiltered.tsv
clean_exonerate_output.dir/GENE_*_filtered.tsv
clean_exonerate_output.dir/GENE_*.bed
Parameters
[exonerate] min_hit_length
Filters and cleans up the Exonerate output.
Converts the raw Exonerate output files into dataframes - GENE_unfiltered.tsv
Filters out any regions containing introns (as defined by Exonerate)
Filters out regions less than
exonerate_min_hit_lengthon the host sequence (in nucleotides).Outputs the filtered regions to GENE_filtered.tsv
Converts this to bed format and outputs this to GENE.bed
mergeOverlaps
Input Files
clean_exonerate_output.dir/GENE_*.bed
Output_Files
gene_bed_files.dir/GENE_all.bed
gene_bed_files.dir/GENE_merged.bed
Parameters
[exonerate] overlap
Merges the output bed files for individual sections of the input genome into a single bed file.
Overlapping regions or very close together regions of the genome detected by Exonerate with similarity to the same retroviral gene are then merged into single regions. This is performed using bedtools merge on the bed files output by cleanExonerate.
If there is a gap of less than exonerate_overlap between the regions they will be merged.
makeFastas
Input Files
gene_bed_files.dir/GENE_merged.bed
genome.fa
Output Files
gene_fasta_files.dir/GENE_merged.fasta
Parameters
None
Fasta files are generated containing the sequences of the merged regions of the genome identified using mergeOverlaps. These are extracted from the host chromosomes using bedtools getfasta.
renameFastas
Input Files
gene_fasta_files.dir/GENE_merged.fasta
Output Files
gene_fasta_files.dir/GENE_merged_renamed.fasta
Parameters
None
Renames the sequences in the fasta files of ERV-like regions identified with Exonerate so each record has a numbered unique ID (gag1, gag2 etc). Also removes “:” from sequence names as this causes problems later.
makeUBLASTDb
Input Files
gene_databases.dir/GENE.fasta
Output Files
UBLAST_db.dir/GENE_db.udb
Parameters
[paths] path_to_usearch
USEARCH requires an indexed database of query sequences to run. This function generates this database for the three gene amino acid fasta files used to screen the genome.
runUBLASTCheck
Input Files
UBLAST_db.dir/GENE_db.udb
gene_fasta_files.dir/GENE_merged_renamed.fasta
Output Files
ublast.dir/GENE_UBLAST_alignments.txt
ublast.dir/GENE_UBLAST.tsv
ublast.dir/GENE_filtered_UBLAST.fasta
Parameters
[paths] path_to_usearch
[usearch] min_id
[usearch] min_hit_length
[usearch] min_coverage
ERV regions in the fasta files generated by makeFasta are compared to the ERV amino acid database files for a second time, this time using USEARCH (https://www.drive5.com/usearch/). Using both of these tools reduces the number of false positives.
This allows sequences with low similarity to known ERVs to be filtered out. Similarity thresholds can be set in the pipeline.ini file (usearch_min_id, - minimum identity between query and target - usearch_min_hit_length - minimum length of hit on target sequence - and usearch_min_coverage - minimum proportion of the query sequence the hit should cover).
The raw output of running UBLAST against the target sequences is saved in GENE_UBLAST_alignments.txt (equivalent to the BLAST default output) and GENE_UBLAST.tsv (equivalent to the BLAST -outfmt 6 tabular output) this is already filtered by passing the appropriate parameters to UBLAST. The regions which passed the filtering and are therefore in these output files are then output to a FASTA file GENE_filtered_UBLAST.fasta.
classifyWithExonerate
Input Files
ublast.dir/GENE_filtered_UBLAST.fasta
ERVsearch/ERV_db/all_ERVs_nt.fasta
Output Files
exonerate_classification.dir/GENE_all_matches_exonerate.tsv
exonerate_classification.dir/GENE_best_matches_exonerate.tsv
exonerate_classification.dir/GENE_refiltered_matches_exonerate.fasta
Parameters
[paths] path_to_exonerate
[exonerate] min_score
Runs the Exonerate ungapped algorithm with each ERV region in the fasta files generated by makeFasta as queries and the all_ERVs_nt.fasta fasta file as a target, to detect which known retrovirus is most similar to each newly identified ERV region. Regions which don’t meet a minimum score threshold (exonerate_min_score) are filtered out.
all_ERVs_nt.fasta contains nucleic acid sequences for many known endogenous and exogenous retroviruses with known classifications.
First all seqeunces are compared to the database and the raw output is saved as exonerate_classification.dirGENE_all_matches_exonerate.tsv. Results need a score greater than exonerate_min_score
against one of the genes of the same type (gag, pol or env) in the database. The highest scoring result which meets these critera for each sequence is then identified and output to exonerate_classification.dir/GENE_best_matches_exonerate.tsv. The sequences which meet these critera are also output to a FASTA file exonerate_classification.dir/GENE_refiltered_exonerate.fasta.
getORFs
Input Files
exonerate_classification.dir/GENE_refiltered_matches_exonerate.fasta
Output Files
ORFs.dir/GENE_orfs_raw.fasta
ORFs.dir/GENE_orfs_nt.fasta
ORFs.dir/GENE_orfs_aa.fasta
Parameters
[orfs] translation_table
[orfs] min_orf_len
Finds the longest open reading frame in each of the ERV regions in the filtered output table.
This analysis is performed using EMBOSS revseq and EMBOSS transeq.
The sequence is translated in all six frames using the user specified translation table. The longest ORF is then identified. ORFs shorter than orfs_min_orf_length are filtered out.
The positions of the ORFs are also convered so that they can be extracted directly from the input sequence file, rather than using the co-ordinates relative to the original Exonerate regions.
The raw transeq output, the nucleotide sequences of the ORFs and the amino acid sequences of the ORFs are written to the output FASTA files.
checkORFsUBLAST
Input Files
ORFs.dir/GENE_orfs_nt.fasta
UBLAST_dbs.dir/GENE_db.udb
Output Files
ublast_orfs.dir/GENE_UBLAST_alignments.txt
ublast_orfs.dir/GENE_UBLAST.tsv
ublast_orfs.dir/GENE_filtered_UBLAST.fasta
Parameters
[paths] path_to_usearch
[usearch] min_id
[usearch] min_hit_length
[usearch] min_coverage
ERV ORFs in the fasta files generated by the ORFs function are compared to the original ERV amino acid files using UBLAST. This allows any remaining sequences with poor similarity to known ERVs to be filtered out.
This allows ORFs with low similarity to known ERVs to be filtered out. Similarity thresholds can be set in the pipeline.ini file (usearch_min_id, - minimum identity between query and target - usearch_min_hit_length - minimum length of hit on target sequence - and usearch_min_coverage - minimum proportion of the query sequence the hit should cover).
The raw output of running UBLAST against the target sequences is saved in GENE_UBLAST_alignments.txt (equivalent to the BLAST default output) and GENE_UBLAST.tsv (equivalent to the BLAST -outfmt 6 tabular output) this is already filtered by passing the appropriate parameters to UBLAST. The regions which passed the filtering and are therefore in these output files are then output to a FASTA file GENE_filtered_UBLAST.fasta.
assignGroups
Input Files
ublast_orfs.dir/GENE_UBLAST.tsv
ERVsearch/ERV_db/convert.tsv
Output Files
grouped.dir/GENE_groups.tsv
Parameters
None
Many of the retroviruses in the input database all_ERVs_nt.fasta have been classified into groups based on sequence similarity, prior knowledge and phylogenetic clustering. Some sequences don’t fall into any well defined group, in these cases they are just assigned to a genus, usually based on prior knowledge. The information about these groups is stored in the provided file ERVsearch/ERV_db/convert.tsv.
Each sequence in the filtered fasta file of newly identified ORFs is assigned to one of these groups based on the sequence identified as the most similar in the classifyWithExonerate step.
The output table is also tidied up to include the UBLAST output, chromosome, ORF start and end positions, genus and group.
summariseScreen
Input Files
gene_bed_files.dir/GENE_merged.bed
ublast.dir/GENE_UBLAST.tsv
ORFs.dir/GENE_orfs_aa.fasta
ublast_orfs.dir/GENE_UBLAST.tsv
Output Files
FMT can be png, svg, pdf, jpg depending on the plot_format parameter
summary_tables.dir/exonerate_initial_summary.txt
summary_tables.dir/ublast_hits_initial_summary.txt
summary_tables.dir/orfs_initial_summary.txt
summary_tables.dir/ublast_orfs_initial_summary.txt
summary_plots.dir/exonerate_initial_lengths.FMT
summary_plots.dir/exonerate_initial_scores.FMT
summary_plots.dir/exonerate_initial_strands.FMT
summary_plots.dir/exonerate_initial_by_sequence.FMT
summary_plots.dir/exonerate_initial_counts_per_gene.FMT
summary_plots.dir/ublast_hits_alignment_length.FMT
summary_plots.dir/ublast_hits_perc_similarity.FMT
summary_plots.dir/ublast_hits_by_match.FMT
summary_plots.dir/ublast_hits_per_gene.FMT
summary_plots.dir/orfs_lengths.FMT
summary_plots.dir/orfs_strands.FMT
summary_plots.dir/orfs_by_gene.FMT
summary_plots.dir/ublast_orfs_alignment_length.FMT
summary_plots.dir/ublast_orfs_perc_similarity.FMT
summary_plots.dir/ublast_orfs_bit_score.FMT
summary_plots.dir/ublast_orfs_by_match.FMT
summary_plots.dir/ublast_orfs_per_gene.FMT
screen_results.dir/results.tsv
screen_results.dir/by_length.FMT
screen_results.dir/by_genus.FMT
screen_results.dir/by_group.FMT
screen_results.dir/by_gene.FMT
Parameters
[plots] dpi
[plots] format
[plots] gag_colour
[plots] pol_colour
[plots] env_colour
[plots] other_colour
[plots] match_axes
Generates a series of summary plots and tables showing the results of running the screening functions.
The major outputs of this function are stored in the screen_results.dir directory. Further details of these files are provided in the Main Output Files section.
The other files show the output of the intermediate steps.
Exonerate Initial
summary_tables.dir/exonerate_initial_summary.txt
Summary of the output of the initial Exonerate screening step. Note that these are unfiltered and many will not be true ERVs.summary_tables.dir/ublast_hits_initial_summary.txt
Summary of the results of running UBLAST on the initial Exonerate output.summary_tables.dir/orfs_initial_summary.txt
Summary of the results of the initial ORF identification.summary_tables.dir/ublast_orfs_initial_summary.txt
Summary of the results of running UBLAST on these ORFs.summary_plots.dir/exonerate_initial_lengths.FMT
Histogram showing the lengths of the initial Exonerate regions for each gene.summary_plots.dir/exonerate_initial_scores.FMT
Histogram showing the Exonerate score of the initial Exonerate regions for each gene.summary_plots.dir/exonerate_initial_strands.FMT
Bar chart showing the number of regions identified on each strand in the initial Exonerate screen.summary_plots.dir/exonerate_initial_by_sequence.FMT
Histogram showing the number of ERV-like regions identified on each sequence in the reference genome being screened.summary_plots.dir/exonerate_initial_counts_per_gene.FMT
Bar chart showing the number of ERV regions identified per gene in the initial Exonerate screen.
UBLAST
summary_plots.dir/ublast_hits_alignment_length.FMT
Histogram showing the lengths of the alignments of the UBLAST filtered Exonerate regions and the most similar reference ORF, based on the UBLAST output.summary_plots.dir/ublast_hits_perc_similarity.FMT
Histogram showing the percentage identity between the UBLAST filtered Exonerate regions and the most similar reference ORF, based on the UBLAST output.summary_plots.dir/ublast_hits_perc_similarity.FMT
Histogram showing the UBLAST bit score between the UBLAST filtered Exonerate regions and the most similar reference ORF, based on the UBLAST output.summary_plots.dir/ublast_hits_by_match.FMT
Bar chart showing the number of UBLAST filtered Exonerate regions most similar to each reference ORF in the ERVsearch/ERV_db database.summary_plots.dir/ublast_hits_per_gene.FMT
Bar chart showing the number of UBLAST filtered Exonerate regions identified per gene.
ORFs
summary_plots.dir/orfs_lengths.FMT
Histogram of the lengths of ORFs identified in the ERV regions.summary_plots.dir/orfs_strands.FMT
Bar chart of the strand (positive (+) or negative (-) sense) of the ORFs identified in the ERV regions.summary_plots.dir/orfs_by_gene.FMT
Bar chart of the number of ORFs identified for each gene.
UBLAST ORFs
summary_plots.dir/ublast_orfs_alignment_length.FMT
Histogram showing the lengths of the alignments of the ERV-like ORFs and the most similar reference ORF, based on the UBLAST output.summary_plots.dir/ublast_orfs_perc_similarity.FMT
Histogram showing the percentage identity between the ERV-like ORFs and the most similar reference ORF, based on the UBLAST output.summary_plots.dir/ublast_orfs_bit_score.FMT
Histogram showing the UBLAST bit score between the ERV-like ORFs and the most similar reference ORF, based on the UBLAST output.summary_plots.dir/ublast_orfs_by_match.FMT
Bar chart showing the number of ERV-like ORFs most similar to each reference ORF in the ERVsearch/ERV_db database.summary_plots.dir/ublast_orfs_per_gene.FMT
Bar chart showing the number of ERV-like ORFs identified per gene.
Screen
Input Files
None
Output Files
None
Parameters
None
Helper function to run all screening functions (all functions prior to this point).
Classify
Classifies the newly identified ORFs into groups based on the most similar known ORF
Aligns the newly identified ORFs with reference sequences within these groups and builds a phylogenetic tree for each group.
Finds clusters of newly identified ORFs within these trees
Incorporates representative sequences from these clusters into a summary tree for each retroviral gene and genus (based on classification into gamma, beta, spuma, alpha, lenti, epsilon and delta retroviruses as defined by the ICTV.
makeGroupFastas
Input Files
grouped.dir/GENE_groups.tsv
ERVsearch/phylogenies/group_phylogenies/*fasta
ERVsearch/phylogenies/summary_phylogenies/*fasta
ERVsearch/phylogenies/outgroups.tsv
Output Files
group_fastas.dir/GENE_(.*)_GENUS.fasta
group_fastas.dir/GENE_(.*)_GENUS_A.fasta
Parameters
None
Two sets of reference fasta files are available (files are stored in ERVsearch/phylogenies/group_phylogenies and ERVsearch/phylogenies/summary_phylogenies)
group_phylogenies - groups of closely related ERVs for fine classification of sequences
summary_phylogenies - groups of most distant ERVs for broad classification of sequences
Sequences have been assigned to groups based on the most similar sequence in the provided ERV database, based on the score using the Exonerate ungapped algorithm. Where the most similar sequence is not part of a a well defined group, it has been assigned to a genus.
Fasta files are generated containing all members of the group from the group_phylogenies file (plus an outgroup) where possible and using representative sequences from the same genus, using the summary_phylogenies file, where only a genus has been assigned, plus all the newly identified ERVs in the group. These files are saved as GENE_(group_name_)GENUS.fasta.
A “~” is added to all new sequence names so they can be searched for easily.
The files are aligned using the MAFFT fftns algorithm https://mafft.cbrc.jp/alignment/software/manual/manual.html to generate the GENE_(group_name_)GENUS_A.fasta aligned output files.
makeGroupTrees
Input Files
group_fastas.dir/GENE_(.*_)GENUS_A.fasta
Output Files
group_trees.dir/GENE_(.*_)GENUS.tre
Parameters
None
Builds a phylogenetic tree, using the FastTree2 algorithm (http://www.microbesonline.org/fasttree) with the default settings plus the GTR model, for the aligned group FASTA files generated by the makeGroupFastas function.
drawGroupTrees
Input Files
group_trees.dir/GENE_(.*_)GENUS.tre
Output Files
group_trees.dir/GENE_(.*_)GENUS.FMT (png, svg, pdf or jpg)
Parameters
[plots] gag_colour
[plots] pol_colour
[plots] env_colour
[trees] use_gene_colour
[trees] maincolour
[trees] highlightcolour
[trees] outgroupcolour
[trees] dpi
[trees] format
Generates an image file for each file generated in the makeGroupTrees step, using ete3 (http://etetoolkit.org). Newly identified sequences are labelled as “~” and shown in a different colour.
By default, newly identified sequences are shown in the colours specified in plots_gag_colour, plots_pol_colour and plots_env_colour - to do this then trees_use_gene_colour should be set to True in the pipeline.ini. Alternatively, a fixed colour can be used by setting trees_use_gene_colour to False and settings trees_highlightcolour. The text colour of the reference sequences (default black) can be set using trees_maincolour and the outgroup using trees_outgroupcolour.
The output file DPI can be specified using trees_dpi and the format (which can be png, svg, pdf or jpg) using trees_format.
makeSummaryFastas
Input Files
group_fastas.dir/GENE_(.*_)GENUS.fasta
group_trees.dir/GENE_(*_)GENUS.tre
ERVsearch/phylogenies/summary_phylogenies/GENE_GENUS.fasta
ERVsearch/phylogenies/group_phylogenies/(.*)_GENUS_GENE.fasta
Output Files
summary_fastas.dir/GENE_GENUS.fasta
summary_fastas.dir/GENE_GENUS.tre
Parameters
None
Based on the group phylogenetic trees generated in makeGroupTrees, monophyletic groups of newly idenified ERVs are identified. For each of these groups, a single sequence (the longest) is selected as representative. The representative sequences are combined with the FASTA files in ERVsearch/phylogenies/summary_phylogenies, which contain representative sequences for each retroviral gene and genus. These are extended to include further reference sequences from the same small group as the newly identified sequences.
For example, if one MLV-like pol and one HERVF-like pol was identified in the gamma genus, the gamma_pol.fasta summary fasta would contain:
* The new MLV-like pol sequence
* The new HERVF-like pol sequence
* The reference sequences from ERVsearch/phylogenies/group_phylogenies/MLV-like_gamma_pol.fasta - highly related sequences from the MLV-like group
* The reference sequences from ERVsearch/phylogenies/group_phylogenies/HERVF-like_gamma_pol.fasta - highly related sequences from the HERVF-like group.
* The reference sequences from ERVsearch/phylogenies/summary_phylogenies/gamma_pol.fasta - a less detailed but more diverse set of gammaretroviral pol ORFs.
* A epsilonretrovirus outgroup
This ensures sufficient detail in the groups of interest while avoiding excessive detail in groups where nothing new has been identified.
These FASTA files are saved as GENE_GENUS.fasta
The files are aligned using the MAFFT fftns algorithm https://mafft.cbrc.jp/alignment/software/manual/manual.html to generate the GENE_GENUS_A.fasta aligned output files.
makeSummaryTrees
Input Files
summary_fastas.dir/GENE_GENUS_A.fasta
Output Files
summary_trees.dir/GENE_GENUS.tre
Parameters
None
Builds a phylogenetic tree, using the FastTree2 algorithm (http://www.microbesonline.org/fasttree) with the default settings plus the GTR model, for the aligned group FASTA files generated by the makeSummaryFastas function.
drawSummaryTrees
Input Files
summary_trees.dir/GENE_GENUS.tre
Output Files
summary_trees.dir/GENE_GENUS.FMT(FMT = png, svg, pdf or jpg)
Parameters
[plots] gag_colour
[plots] pol_colour
[plots] env_colour
[trees] use_gene_colour
[trees] maincolour
[trees] highlightcolour
[trees] outgroupcolour
[trees] dpi
[trees] format
Generates an image file for each file generated in the makeSummaryTrees step, using ete3 (http://etetoolkit.org). Newly identified sequences are labelled as “~” and shown in a different colour. Monophyletic groups of newly identified ERVs have been collapsed (by choosing a single representative sequence) and the number of sequences in the group is added to the label and represented by the size of the node tip.
By default, newly identified sequences are shown in the colours specified in plots_gag_colour, plots_pol_colour and plots_env_colour - to do this then trees_use_gene_colour should be set to True in the pipeline.ini. Alternatively, a fixed colour can be used by setting trees_use_gene_colour to False and settings trees_highlightcolour. The text colour of the reference sequences (default black) can be set using trees_maincolour and the outgroup using trees_outgroupcolour.
The output file DPI can be specified using trees_dpi and the format (which can be png, svg, pdf or jpg) using trees_format.
summariseClassify
Input Files
summary_fastas.dir/GENE_GENUS.fasta
summary_trees.dir/GENE_GENUS.tre
Output Files
classify_results.dir/results.tsv
classify_results.dir/by_gene_genus.FMT (png, svg, pdf or jpg)
Parameters
None
Combines the results of the classify steps to generate additional summary files. The results.tsv output file lists the number of genes which have been collapsed into each group in the trees in the summary_trees.dir directory. The by_gene_genus.FMT plot is a bar chart of the same information, organised by gene and genus.
Classify
Input Files None
Output Files None
Parameters None
Helper function to run all screening functions and classification functions (all functions prior to this point).
ERVRegions
Identifies regions of the genome containing ORFs resembling more than one different retroviral gene within a certain distance
makeCleanBeds
Input Files
grouped.dir/GENE_groups.tsv
Output Files
clean_beds.dir/GENE.bed
Parameters
None
Generates a bed file for each gene which contains the co-ordinates of the ORFs which have passed all filtering criteria in the Screen section.
makeCleanFastas
Input Files
clean_beds.dir/GENE.bed
genome.fa
Output Files
clean_fastas.dir/GENE.fasta
Parameters
None
Fasta files are generated containing the sequences of the regions listed by makeCleanBeds. These are extracted from the host chromosomes using bedtools getfasta (https://bedtools.readthedocs.io/en/latest/content/tools/getfasta.html).
findERVRegions
Input Files
clean_fastas.dir/*.fasta
Output Files
ERV_regions.dir/all_ORFs.bed
ERV_regions.dir/all_regions.bed
ERV_regions.dir/multi_gene_regions.bed
ERV_regions.dir/regions.fasta
Parameters
[regions] maxdist
Combines the files containng the ORF regions for the different retroviral genes and merges any regions which are within regions_maxdist of each other to find larger regions containing multiple genes.
The all_ORFs.bed output file is the concatenated and sorted bed files, all_regions.bedcontains the merged regions with any ORFs within regions_maxdist of each other (end to end) combined, plus all regions with a single ORF, generated from all_regions.bed using bedtools merge (https://bedtools.readthedocs.io/en/latest/content/tools/merge.html). The name, strand and score columns are concatenated for merged regions, delimited with a “,”.
multi_gene_regions.bed contains only the regions which were found to contain multiple ORFs, regions.fasta is the sequence of these regions in FASTA format. At this point this includes regions with multiple ORFs from the same gene (e.g. two pol ORFs).
makeRegionTables
Input Files
ERV_regions.dir/multi_gene_regions.bed
grouped.dir/*_groups.tsv
genome.fa
Output Files
ERV_regions.dir/ERV_regions_final.tsv
ERV_regions.dir/ERV_regions_final.bed
ERV_regions.dir/ERV_regions_final.fasta
Parameters
[regions] maxoverlap
Takes a merged bed file consisting of regions of the genome identified as having more than one ERV-like ORF, finds the regions within this file which contain more than one different gene (e.g. gag and pol instead of two gag ORFs) and outputs a formatted table of information about these regions.
The output table (ERV_regions_final.tsv) will usually have 37 columns:
name- the final ID of the ERV region - the genes found plus an integer e.g. gag_pol_12chrom- chromosomestart- start position of the ERV regionend- end position of the ERV regionstrand- strand of the ERv regiongenus- genus of the ERV region, can be multiple genera delimted by “|” if different genes had different generafor each gene screened for (usually gag, pol and env)
GENE_name- the names of the ORFs for this gene in this regionGENE_ID- the original IDs of the ORFs for this gene in this regionGENE_start- the start position of this gene in this region (genome co-ordinates)GENE_relative_start- the start position of this gene in this region (relative to the start of the region)GENE_end- the end position of this gene in this region (genome co-ordinates)GENE_relative_end- the end position of this gene in this region (relative to the start of the region)GENE_strand- the strand for this gene in this regionGENE_match- the closest reference retrovirus to this gene in this regionGENE_group- the group of the closest reference retrovirus to this gene in this regionGENE_genus- the genus of the closest reference retrovirus to this gene in this region
orig_name- the name of the region in the input table
If not all genes are screened for the table will not have the columns for this gene.
A bed file (ERV_regions_final.bed) is generated with the co-ordinates of the identified regions and a FASTA file (ERV_regions_final.fasta) containing their sequences.
plotERVRegions
Input_Files
ERV_regions.dir/ERV_regions_final.tsv
Output_Files
ERV_region_plots.dir/*FMT
Parameters
[plots] format
[plots] dpi
[plots] gag_colour
[plots] pol_colour
[plots] env_colour
For each region containing ORFs resembling more than one retroviral gene, a plot is generated showing how these ORFs are distributed on the genome relative to each other.
Each gene is shown on a different line on the y axis, the x axis is chromosome co-ordinates.
summariseERVRegions
Input Files
ERV_regions.dir/ERV_regions_final.tsv
Output Files
erv_regions_results.dir/results.tsv
[erv_regions_results.dir/erv_regions.FMT](introduction.html#id3
Parameters
[plots] other_colour
Combines the results of the ERVregions steps to generate additional summary files.
The results.tsv output file is a copy of the output of the makeRegionTables functions.
This will usually have 37 columns:
name- the final ID of the ERV region - the genes found plus an integer e.g. gag_pol_12chrom- chromosomestart- start position of the ERV regionend- end position of the ERV regionstrand- strand of the ERv regiongenus- genus of the ERV region, can be multiple genera delimted by “|” if different genes had different generafor each gene screened for (usually gag, pol and env)
GENE_name- the names of the ORFs for this gene in this regionGENE_ID- the original IDs of the ORFs for this gene in this regionGENE_start- the start position of this gene in this region (genome co-ordinates)GENE_relative_start- the start position of this gene in this region (relative to the start of the region)GENE_end- the end position of this gene in this region (genome co-ordinates)GENE_relative_end- the end position of this gene in this region (relative to the start of the region)GENE_strand- the strand for this gene in this regionGENE_match- the closest reference retrovirus to this gene in this regionGENE_group- the group of the closest reference retrovirus to this gene in this regionGENE_genus- the genus of the closest reference retrovirus to this gene in this region
orig_name- the name of the region in the input table
A bar chart - erv_regions_results.dir/erv_regions.FMT is also generated showing the number of ERV regions found with each combination of genes.
ERVRegions
Input Files None
Output Files None
Parameters None
Helper function to run all screening functions and ERVRegions functions.